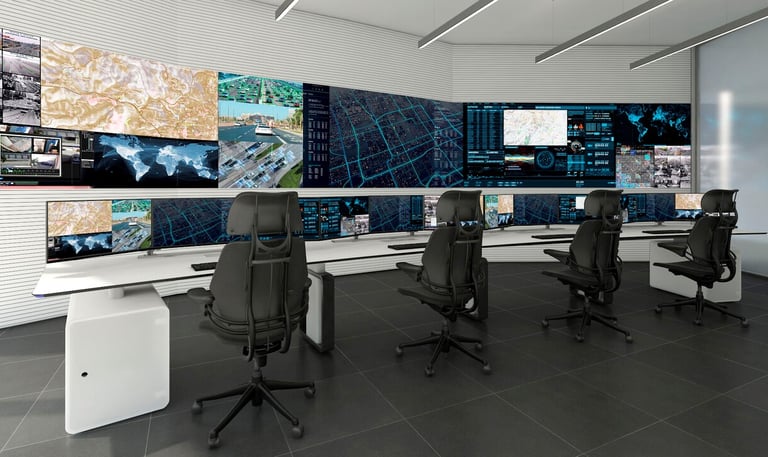
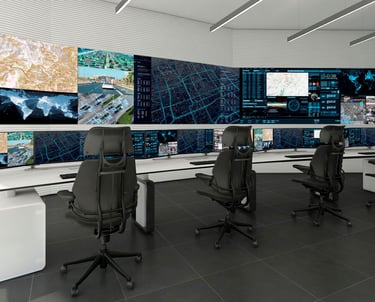
Explore our new headquarters and see what’s new at our company.
XIMOS DCIM
Monitor and manage your data center infrastructure with advanced 3D visualization and carbon footprint tracking.
Monitoring · Savings · Efficiency
Our XIMOS monitoring system…
It is composed of 3 modules:
Infrastructure Monitoring & Management
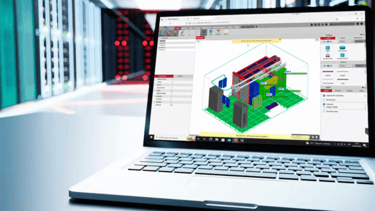
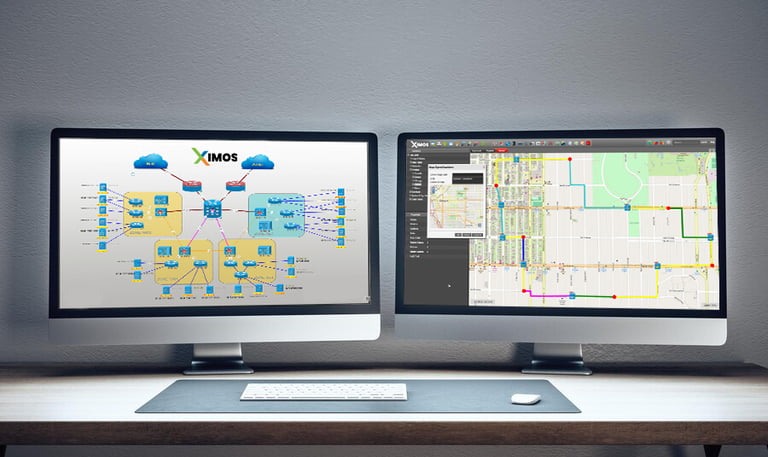
3D Monitoring
Carbon Zero


DCIM
Synthetic web monitoring for end users, high availability, and proxy-based load balancing.

Customized Solutions · Scalability · Performance
Enhance performance and scalability with tailored, scalable solutions.Carbon Footprint Reduction Tools for Data Centers
Track and optimize efforts to reduce the carbon footprint generated by data centers.Synthetic Web Monitoring for End Users
Ensure high availability and proxy-based load balancing for reliable web monitoring.
Integrations
Efficiency through customizable solutions for web monitoring and load balancing.
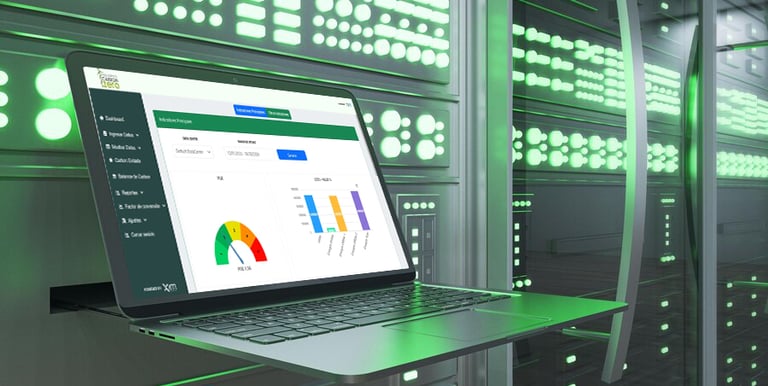
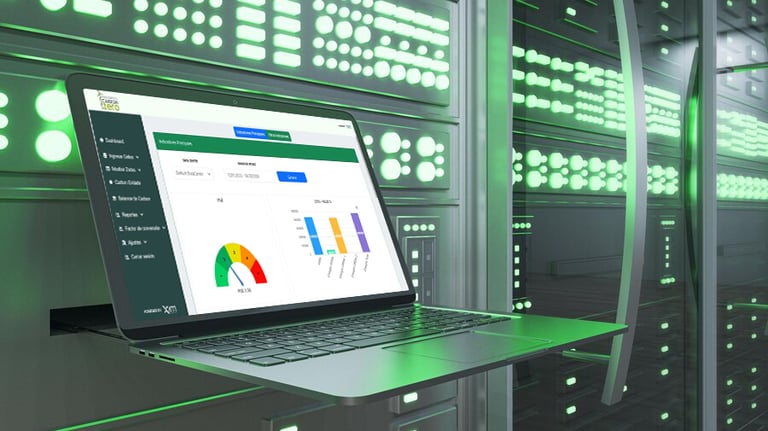
Carbon Zero
A powerful tool to track efforts aimed at reducing the carbon footprint generated by our data centers. This solution helps gather the necessary data to achieve LEED certification and access the benefits associated with this type of certification.
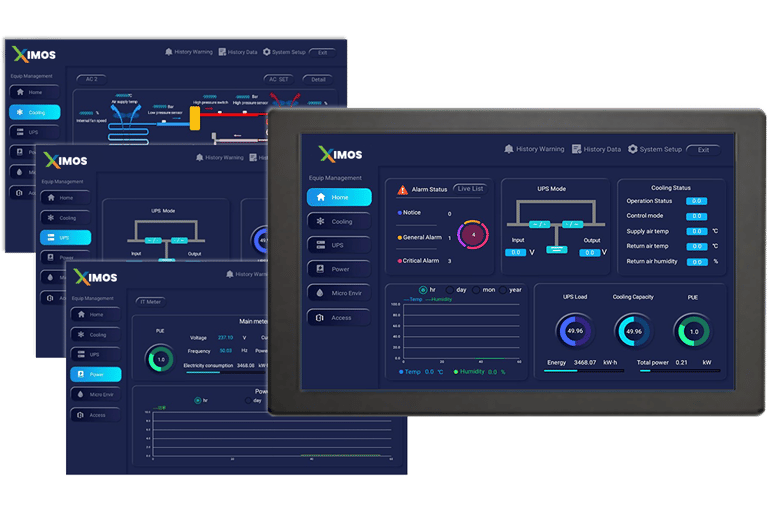
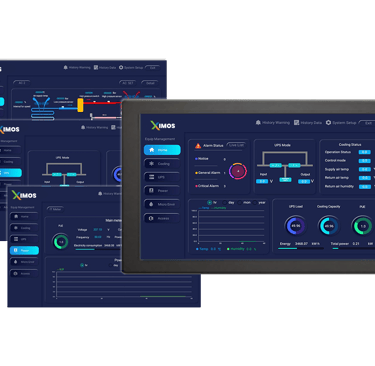
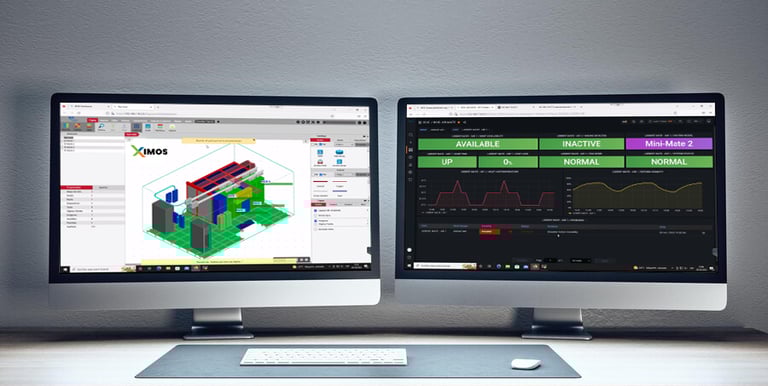
IT Monitoring & Management
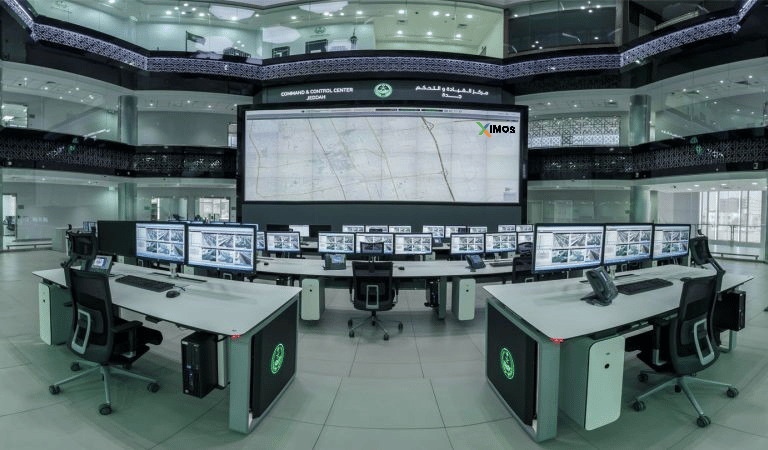
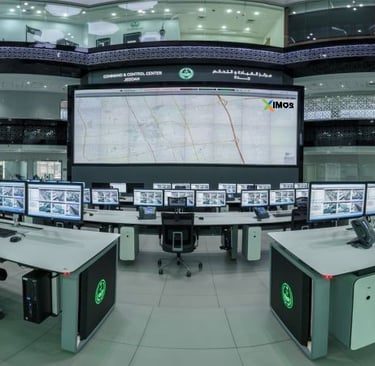
100% graphical monitoring of networks, devices, and the entire data center, creating a data center metaverse fully at your fingertips. With simple drag-and-drop functionality, you can add devices to your network and start monitoring new equipment without technical assistance.
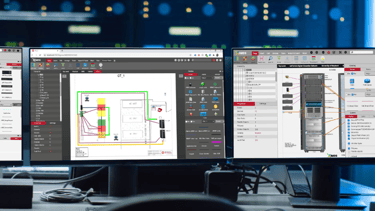
Why Zabbix and Grafana?
Optimize your infrastructure with Grafana and Zabbix: comprehensive monitoring and advanced visualization.
Zabbix
Known for its scalability and flexibility, Zabbix provides comprehensive monitoring ranging from servers to network devices and applications. Its ability to generate proactive and customizable alerts ensures a rapid response to any anomaly.
Grafana
This leading visualization tool enables the creation of dynamic and interactive dashboards that simplify the interpretation of complex data. Grafana not only enhances the visualization of critical metrics, but also supports in-depth analysis for identifying trends and patterns.
Our new version, released under the GNU Affero General Public License v3 (AGPLv3),
introduces features such as synthetic web monitoring for end users, high availability, and proxy-based load balancing. These improvements in performance and scalability, along with native support for multi-factor authentication (MFA), enable new ways to visualize your data and the status of both the physical and logical infrastructure of your data center—along with many more features.
XIMOS DCIM

©XIM Technology LLC 2026. All rights reserved
Contact
+1 305 216-6253
Address:
1905 Intermodal Circle Palmetto, Fl 34221 United States of America